
Role
UX Designer
Client
Sofar Sounds
Year
2019
Team Size
6
Background
Background
Background
Sofar Sounds aimed for growth through a Pay Per Click (PPC) strategy. Analysis revealed that the city pages experienced a significant bounce rate. Our goal was to decrease this rate and encourage more users to progress through the purchasing funnel to buy tickets.
Sofar Sounds aimed for growth through a Pay Per Click (PPC) strategy. Analysis revealed that the city pages experienced a significant bounce rate. Our goal was to decrease this rate and encourage more users to progress through the purchasing funnel to buy tickets.
Sofar Sounds aimed for growth through a Pay Per Click (PPC) strategy. Analysis revealed that the city pages experienced a significant bounce rate. Our goal was to decrease this rate and encourage more users to progress through the purchasing funnel to buy tickets.
Objective
Objective
Objective
Boost the percentage of users creating a Sofar account from 4.6% to 8%.
Role
Role
Role
Unde omnis iste natus error sed ut perspiciatis voluptatem sit. Ad minima veniam, ut enim nostrum exercitationem suscipit ullam corporis laboriosam quis. Est neque porro quisquam, qui dolor ipsum quia dolor sit amet, consectetur, velit adipisci.
Unde omnis iste natus error sed ut perspiciatis voluptatem sit. Ad minima veniam, ut enim nostrum exercitationem suscipit ullam corporis laboriosam quis. Est neque porro quisquam, qui dolor ipsum quia dolor sit amet, consectetur, velit adipisci.
Unde omnis iste natus error sed ut perspiciatis voluptatem sit. Ad minima veniam, ut enim nostrum exercitationem suscipit ullam corporis laboriosam quis. Est neque porro quisquam, qui dolor ipsum quia dolor sit amet, consectetur, velit adipisci.


Planning & Testing
Planning & Testing
Planning & Testing
We tested the current PPC flow with 10 participants. Half of them were new to Sofar events, while the other half had attended at least one. Each session began with a critical incident interview, where participants shared recent experiences or live music events they had attended. As they spoke, I used post-it notes to visually map out their user journey in real-time.
Next, we transitioned to the user research phase of the testing. Participants interacted with the prototype to explore the journey from a paid Facebook ad to the Sofar city landing page. Feedback was provided throughout the process, and both the participant's actions and the screen were recorded.
Persona creation
Persona creation
Persona creation
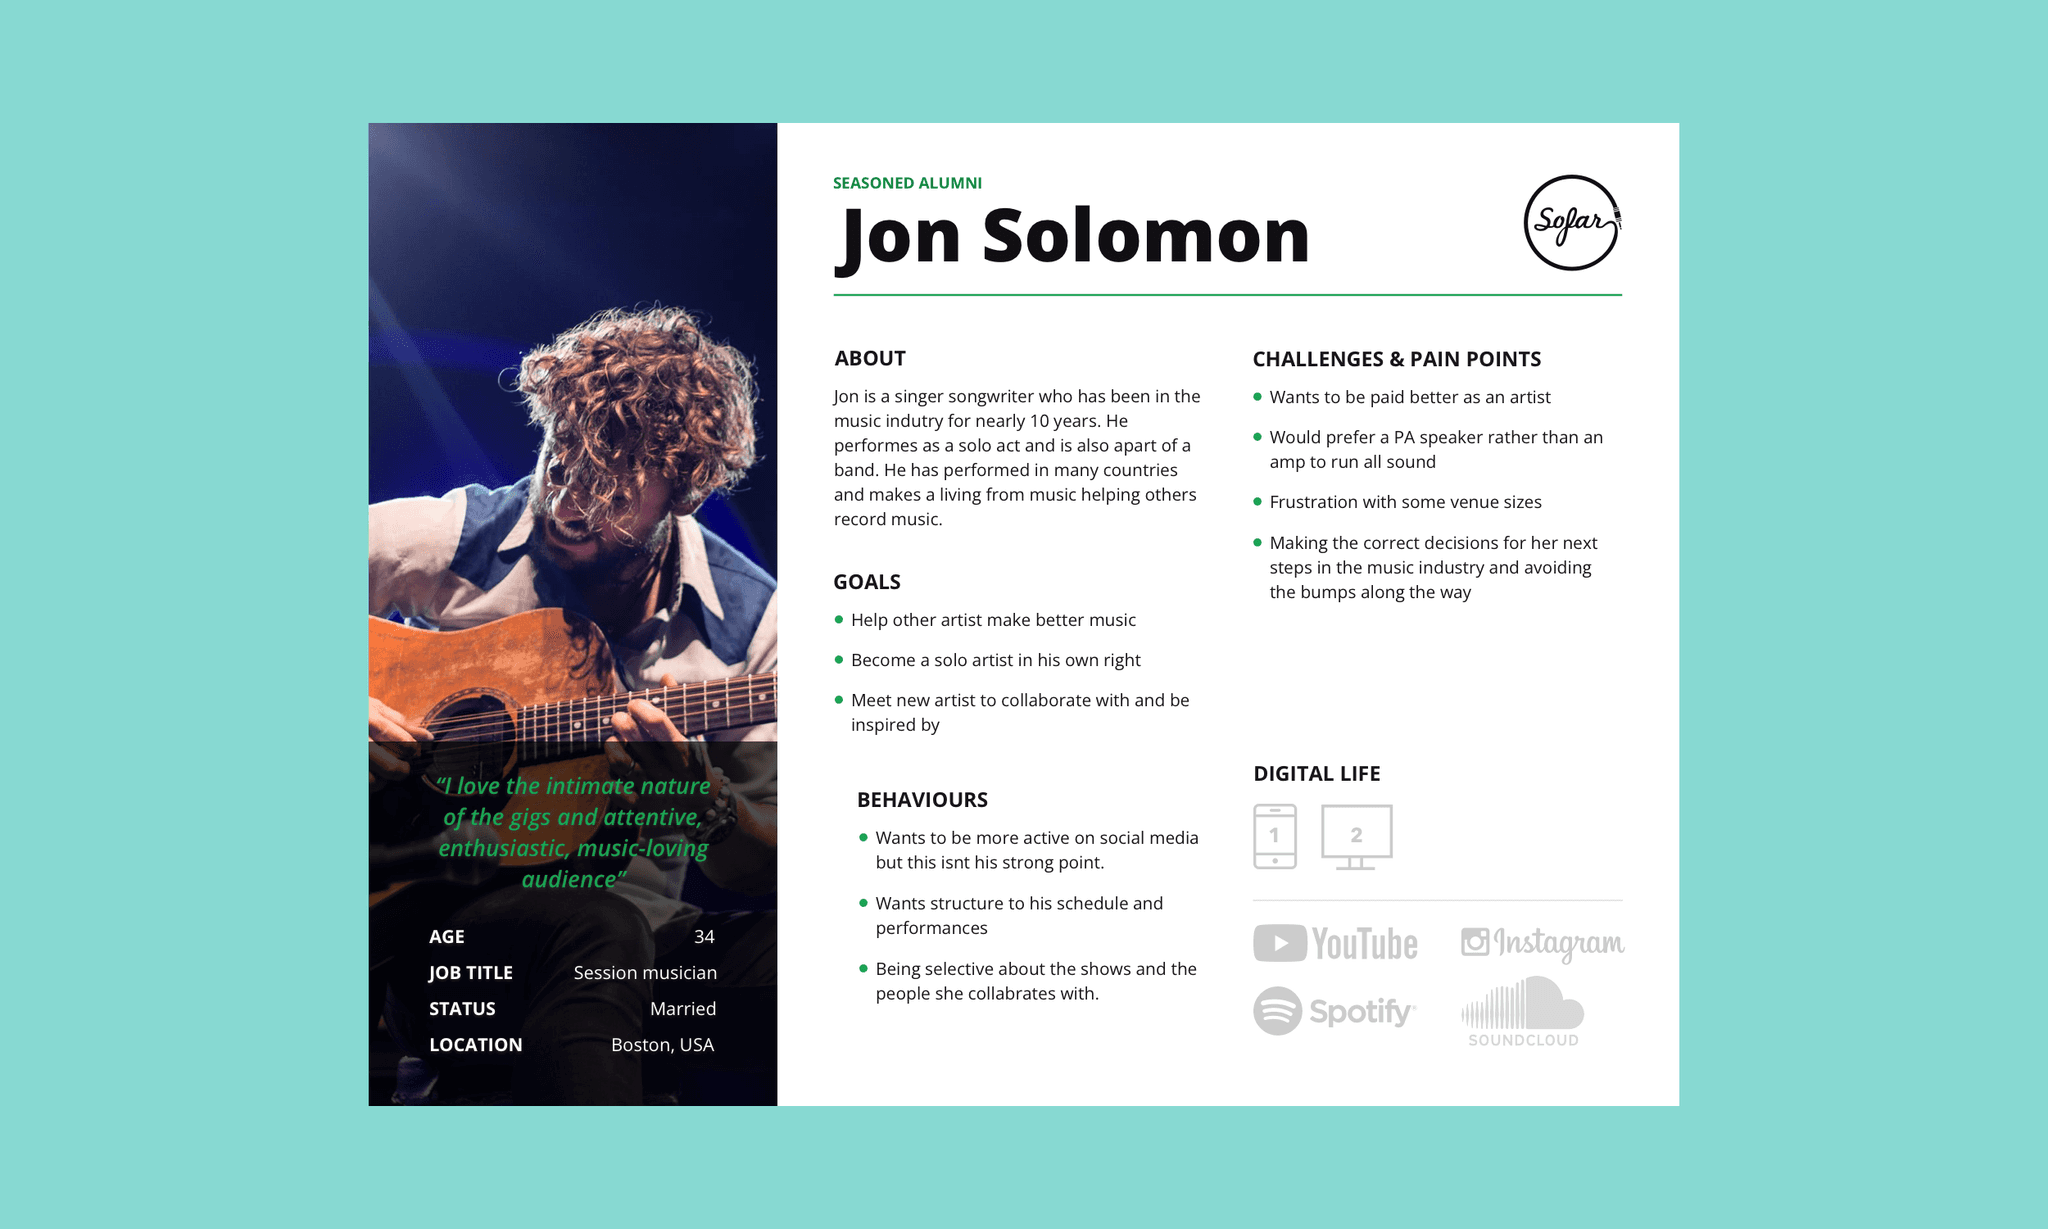
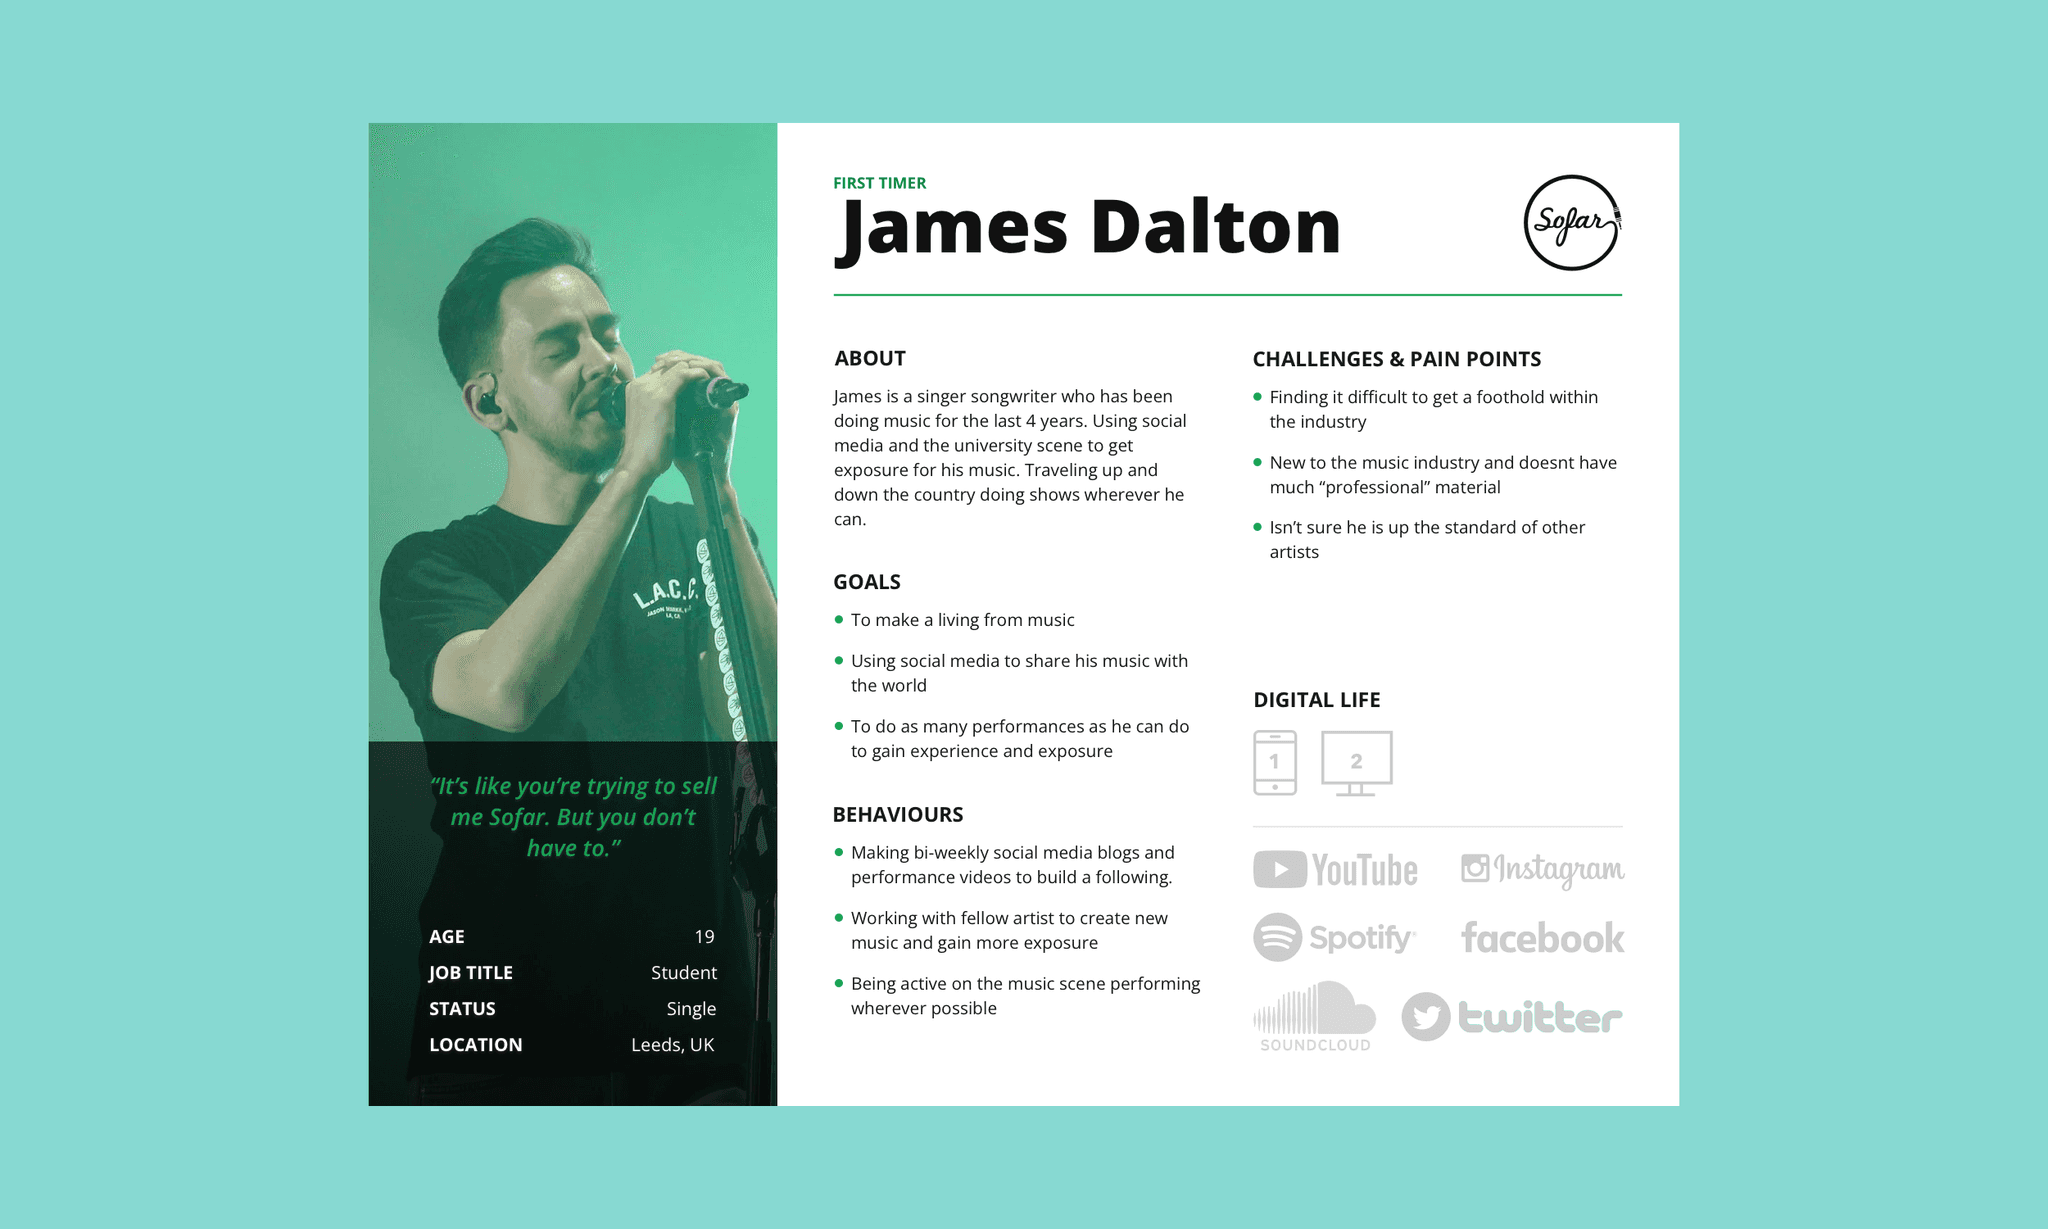
Based on the gathered data, I developed three personas and outlined their user journeys. These personas were then utilised in a brainstorming session to formulate "how might we" questions.
Based on the gathered data, I developed three personas and outlined their user journeys. These personas were then utilised in a brainstorming session to formulate "how might we" questions.
Based on the gathered data, I developed three personas and outlined their user journeys. These personas were then utilised in a brainstorming session to formulate "how might we" questions.


Research synthesis
Research synthesis
Research synthesis
Insights gathered from testing revealed common themes hindering users from finishing their application. To delve deeper, we conducted a Hotjar poll on the London city page, asking: "Do you have any questions about the following before you complete your application?" The responses were as follows:
Price: 58%
Genre: 37%
Show duration: 17%
Venue details: 13%
How Sofar works: 13%
Other: 0%
Issues impeding users from purchasing tickets included value proposition messaging, music selection, atmosphere, pricing, safety, trustworthiness, diversity and inclusion, and venue/location. We then categorised these themes on a prioritisation matrix of value versus effort to guide our approach. Ultimately, we addressed all these themes through our design iterations.


Results
Results
Results
Our goal was to boost the conversion rate by 3.1%. The updated designs led to a remarkable 13% increase in conversion rate and a notable 41% improvement in activation rate. This marks a significant achievement.
Below, you'll find the original city page on the left, which hadn't been updated in five years. On the right, you can see our new and enhanced design.


